
New to the ACER Data Explorer: Predicted scale score gain
Feature 14 Feb 2024 6 minute readOne of our most asked questions is ‘how much should my students grow each year’? The answer is complex.
At ACER, we know that each student has their own learning trajectory. Many factors can influence their learning growth each year, especially as PAT assessments are a measurement taken at a single point in time.
We also know that teachers may require additional context when interpreting their students' scores in order to get a sense of their learning journeys. To meet this need, ACER has added the new feature of predicted scale score gain (or ‘predicted gain’) to PAT Maths Adaptive and PAT Reading Adaptive reports in the ACER Data Explorer.
What is ‘predicted gain’?
To incorporate this new feature into the ACER Data Explorer, we asked ‘For students in the same year level whose initial (prior) scale scores were the same or very similar, what might be the typical scale score gain achieved after a given time interval?’
The answer is a statistical prediction based on a student’s year level and current scale score only. The prediction does not account for:
- curriculum standards or achievement levels
- your school or classroom goals
- individual student context or demographic details, with the exception of year level
- prior learning progress or achievement trends.
Importantly, a student’s predicted gain does not constitute their expected gain, or what they should achieve after a given time interval. It is not a benchmark or standard to be measured against.
Which data is ‘predicted gain’ based on?
ACER undertook a study of how the differences in year level, prior scores and time affected the scale score gain between 2 tests completed by the same student.
Year level was the student’s year level at the time the first of the 2 tests was administered. Prior scale score was the scale score achieved by the student on the first of the 2 tests. Time was the interval between the 2 tests administered.
ACER psychometricians analysed a large set of test results from PAT Maths 4th edition and PAT Reading 5th edition completed by Australian students in 2020 and 2021. In particular, the study used results from students who had completed 2 tests in the same learning area within a period of between 6.5 and 24 months.
The study modelled the effects of prior scale score and time between tests on students’ scale score gain for each year level. These models can then be applied to predict scale score gain for a given student.
How should predicted gain be used?
The gain prediction between 2 successive assessments over a relatively short period should not be used to make a value judgement about the quality of a student’s broader learning progress. Instead, these gain predictions offer an additional piece of information to assist teachers to understand their assessment data and student achievement on PAT generally.
The predictions, as represented in the online reports, are useful in visualising the variability of assessment results, especially when looking at only 2 points of measurement. Students’ long-term learning trajectories are always the most important consideration, and no single assessment should be relied upon as the sole measure of student achievement or learning growth. Information about students’ learning should be gathered regularly and from multiple sources and considered through the lens of your professional judgement.
How do I access the predicted gain feature?
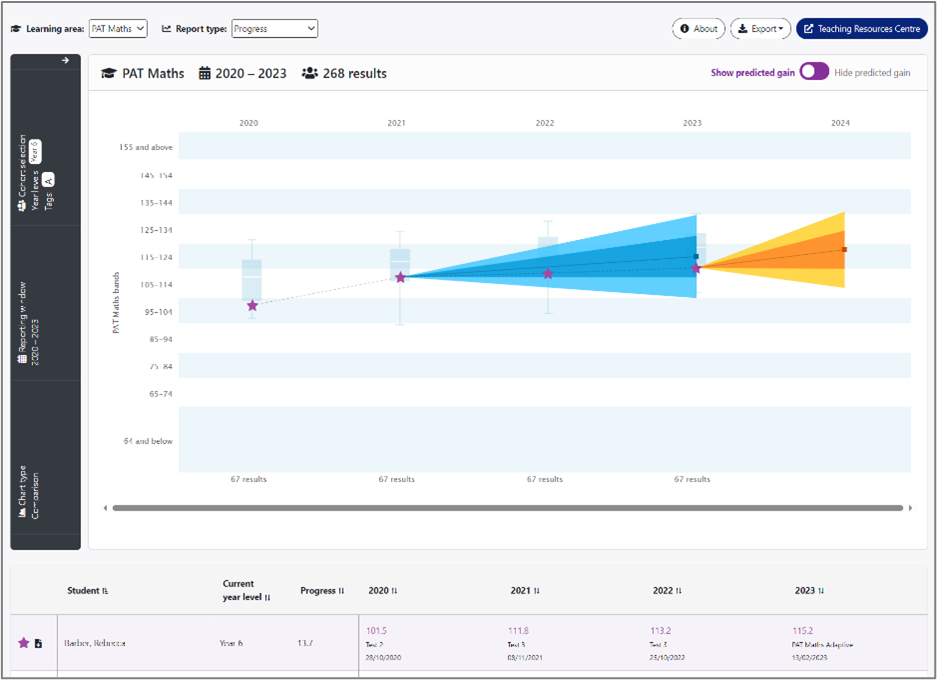
Schools using PAT Maths Adaptive or PAT Reading Adaptive can view predicted gain for PAT Maths and PAT Reading in the Progress report within the online ACER Data Explorer.
Highlight a student in the Progress report and select ‘Show predicted gain’ above the report chart:
How do I interpret the predicted gain shown in the report?
Our reporting goal was to provide an indication of the range of scale scores that are typically achieved by students, given a particular scale score starting point and the time interval between assessments, at a particular year level.
Within the online ACER Data Explorer, a student’s predicted PAT Maths or PAT Reading scale score gain is shown along with an inner and outer range that represent a degree of uncertainty around the prediction.
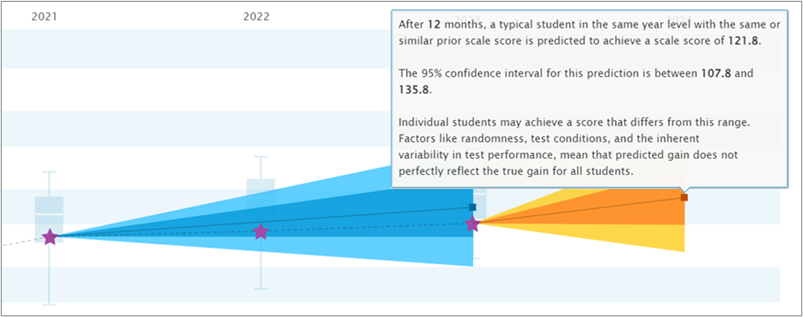
In most cases, reports will show a student’s ‘future’ predicted gain (in orange), indicating how students at similar levels might typically achieve 12 months after an initial test. This projection extends within the chart from the star representing the student’s most recent test. If the student has also completed a test within the previous 9 to 18 months, a ‘past’ prediction (in blue) will also be shown in the chart. This allows teachers to compare a student’s actual achievement on the most recent test to their predicted achievement based on an earlier test.
The inner, darker ranges of each projection represent one standard deviation, or the 68% confidence interval, on either side of the prediction. This means that 68% of the time, the observed gain for this student will fall within that interval. The broader, lighter ranges represent two standard deviations, or the 95% confidence interval, on either side of the prediction. This interval is wider and we expect that 95% of the time, the observed gain for this student will fall within this range.
Find out more about predicted gain
To learn more about this new feature, we suggest attending our free webinar on 13 March or contacting our support team, school.support@acer.org.